
Do you want to become a successful binary options trader? Then you need to learn how to read binary options charts. Binary options charts provide visual representations of price movements, which allow traders to make trading decisions quickly and accurately. In this comprehensive guide, we will explain what binary options charts are, how they work and why they are important for successful trading.
What Are Binary Options Charts?
First off, let’s take a look at what binary options charts are. Binary options charts provide visual representations of the closing prices of assets over a specific period of time. Traders use these charts to analyze the price action of an asset and make better trading decisions based on these visual representations. There are two main types of binary options charts: candlestick charts and bar charts.
When looking at a binary options chart, traders can identify certain patterns such as support and resistance levels or trends in the price action. These patterns help traders make decisions on where to place their trades. In addition, technical analysts also use a variety of technical indicators to analyze these charts and develop trading strategies that incorporate both price movements and technical indicators.
Expiration Time, Price, And Other Factors
The time period for which a chart is drawn depends on the time frame that the trader is using for his/her trading strategy. Generally speaking, longer time frames (daily or weekly) are used by trend-following strategies while shorter time frames ( 5 minutes or hourly) are used by scalpers.
Besides, there are other factors that traders should consider when analyzing binary options charts. For instance, the lowest price of an asset on a chart is important for determining support levels, while the highest price of an asset is important for determining resistance levels. In addition, some trading platforms also provide advanced trading tools such as Fibonacci retracement and MACD histogram to help traders analyze the markets and make better decisions.
Finally, it’s worth mentioning that practice makes perfect when it comes to trading. Thus, in order to develop successful strategies and become a profitable binary options trader it’s very important to practice trading with a demo account before investing real money.
Making the Most Out of Binary Options Charts
Now that you know what binary options charts are and why they are important, let’s take a look at how you can make the most out of them. First off, it’s essential to choose the right charting platform for your trading strategy. There are many charting platforms available on the market so make sure to do your research and find one that meets all your needs.
Once you have chosen the right charting platform, make sure to familiarize yourself with it. Take some time to explore all the features it offers and practice using the different tools before committing real money. This way, you will be able to learn how everything works, analyze different charts and trading patterns, and develop your own trading strategy.
Popular Types Of Binary Options Charts
When it comes to binary options charts, there are several types of charts available. The most popular type is the candlestick chart, which offers a simple and intuitive layout. This type of chart shows the opening, closing, and high and low prices of an asset over a specific period of time. Candlesticks can help traders identify support and resistance levels as well as analyze trends in price action.
Another popular type of binary options chart is the bar chart, which shows the open, close high and low prices over a certain period of time. This type of chart may also be used to identify support and resistance levels as well as potential trading opportunities. Finally, some trading platforms also offer line charts that show only the closing prices over a certain period of time.
How Are Binary Options Charts Developed?
There are three main components that must be considered: the data source, the software used to create the chart, and the type of chart. When it comes to data sources, there are various exchanges and brokers that offer price data which can be used to develop a chart. The most popular data sources are those from the CME Group, NYSE, AMEX, and Nasdaq.
The second component is the software used to create a chart. There is a wide range of software available on the market aimed at both experienced traders and newbies alike. This software allows traders to customize their charts with different indicators such as moving averages and Fibonacci retracements which can help them make better trading decisions.
Finally, the type of chart used will depend on the individual’s trading strategy and level of experience. For instance, technical analysts may prefer candlestick charts as they offer more information than line or bar charts. On the other hand, new traders may find line or bar charts easier to understand and analyze. No matter which type of chart you choose, it’s important to remember that practice makes perfect and that learning how to read binary options charts is essential for success in this type of trading.
Beginner Strategies For Binary Options Trading
If you’re new to binary options trading, then the best way to start is by utilizing beginner strategies. These are simple trading strategies that involve buying and selling contracts based on price movements in different markets.
A great strategy for beginners is to focus on one specific asset class or underlying asset. This will allow you to gain an understanding of how the market works and how different assets react under certain conditions. Additionally, it’s important to take some time to understand the indicators that can help you perform technical analysis and make informed decisions about when and where to place your trades. For example, many binary options traders rely on stochastic oscillators and moving averages in order to identify potential entry and exit points.

Learning how to read binary options charts is essential for successful trading. Binary options charts provide visual representations of price movements, which allow traders to make informed decisions quickly and accurately.
It’s important to choose the right charting platform and familiarize yourself with it before committing real money. Finally, practice makes perfect so it’s important to practice trading with a demo account in order to become a profitable binary options trader.
Binary options charts are an essential tool for traders to analyze market trends and make informed decisions. Understanding how to read these charts is critical for anyone looking to trade binary options in the UK effectively. These charts display the movement of prices over time and are the basis for implementing various trading strategies and making predictions about future price movements.
Types of Binary Options Charts
- Line Charts: The simplest form, showing price movement in a line, depicting the closing prices of assets over a set period.
- Bar Charts: More information than line charts, displaying opening, closing, high, and low prices.
- Candlestick Charts: Offer a visual representation of price movements, showing the same information as bar charts but in a way that many find easier to interpret.
Reading Candlestick Charts
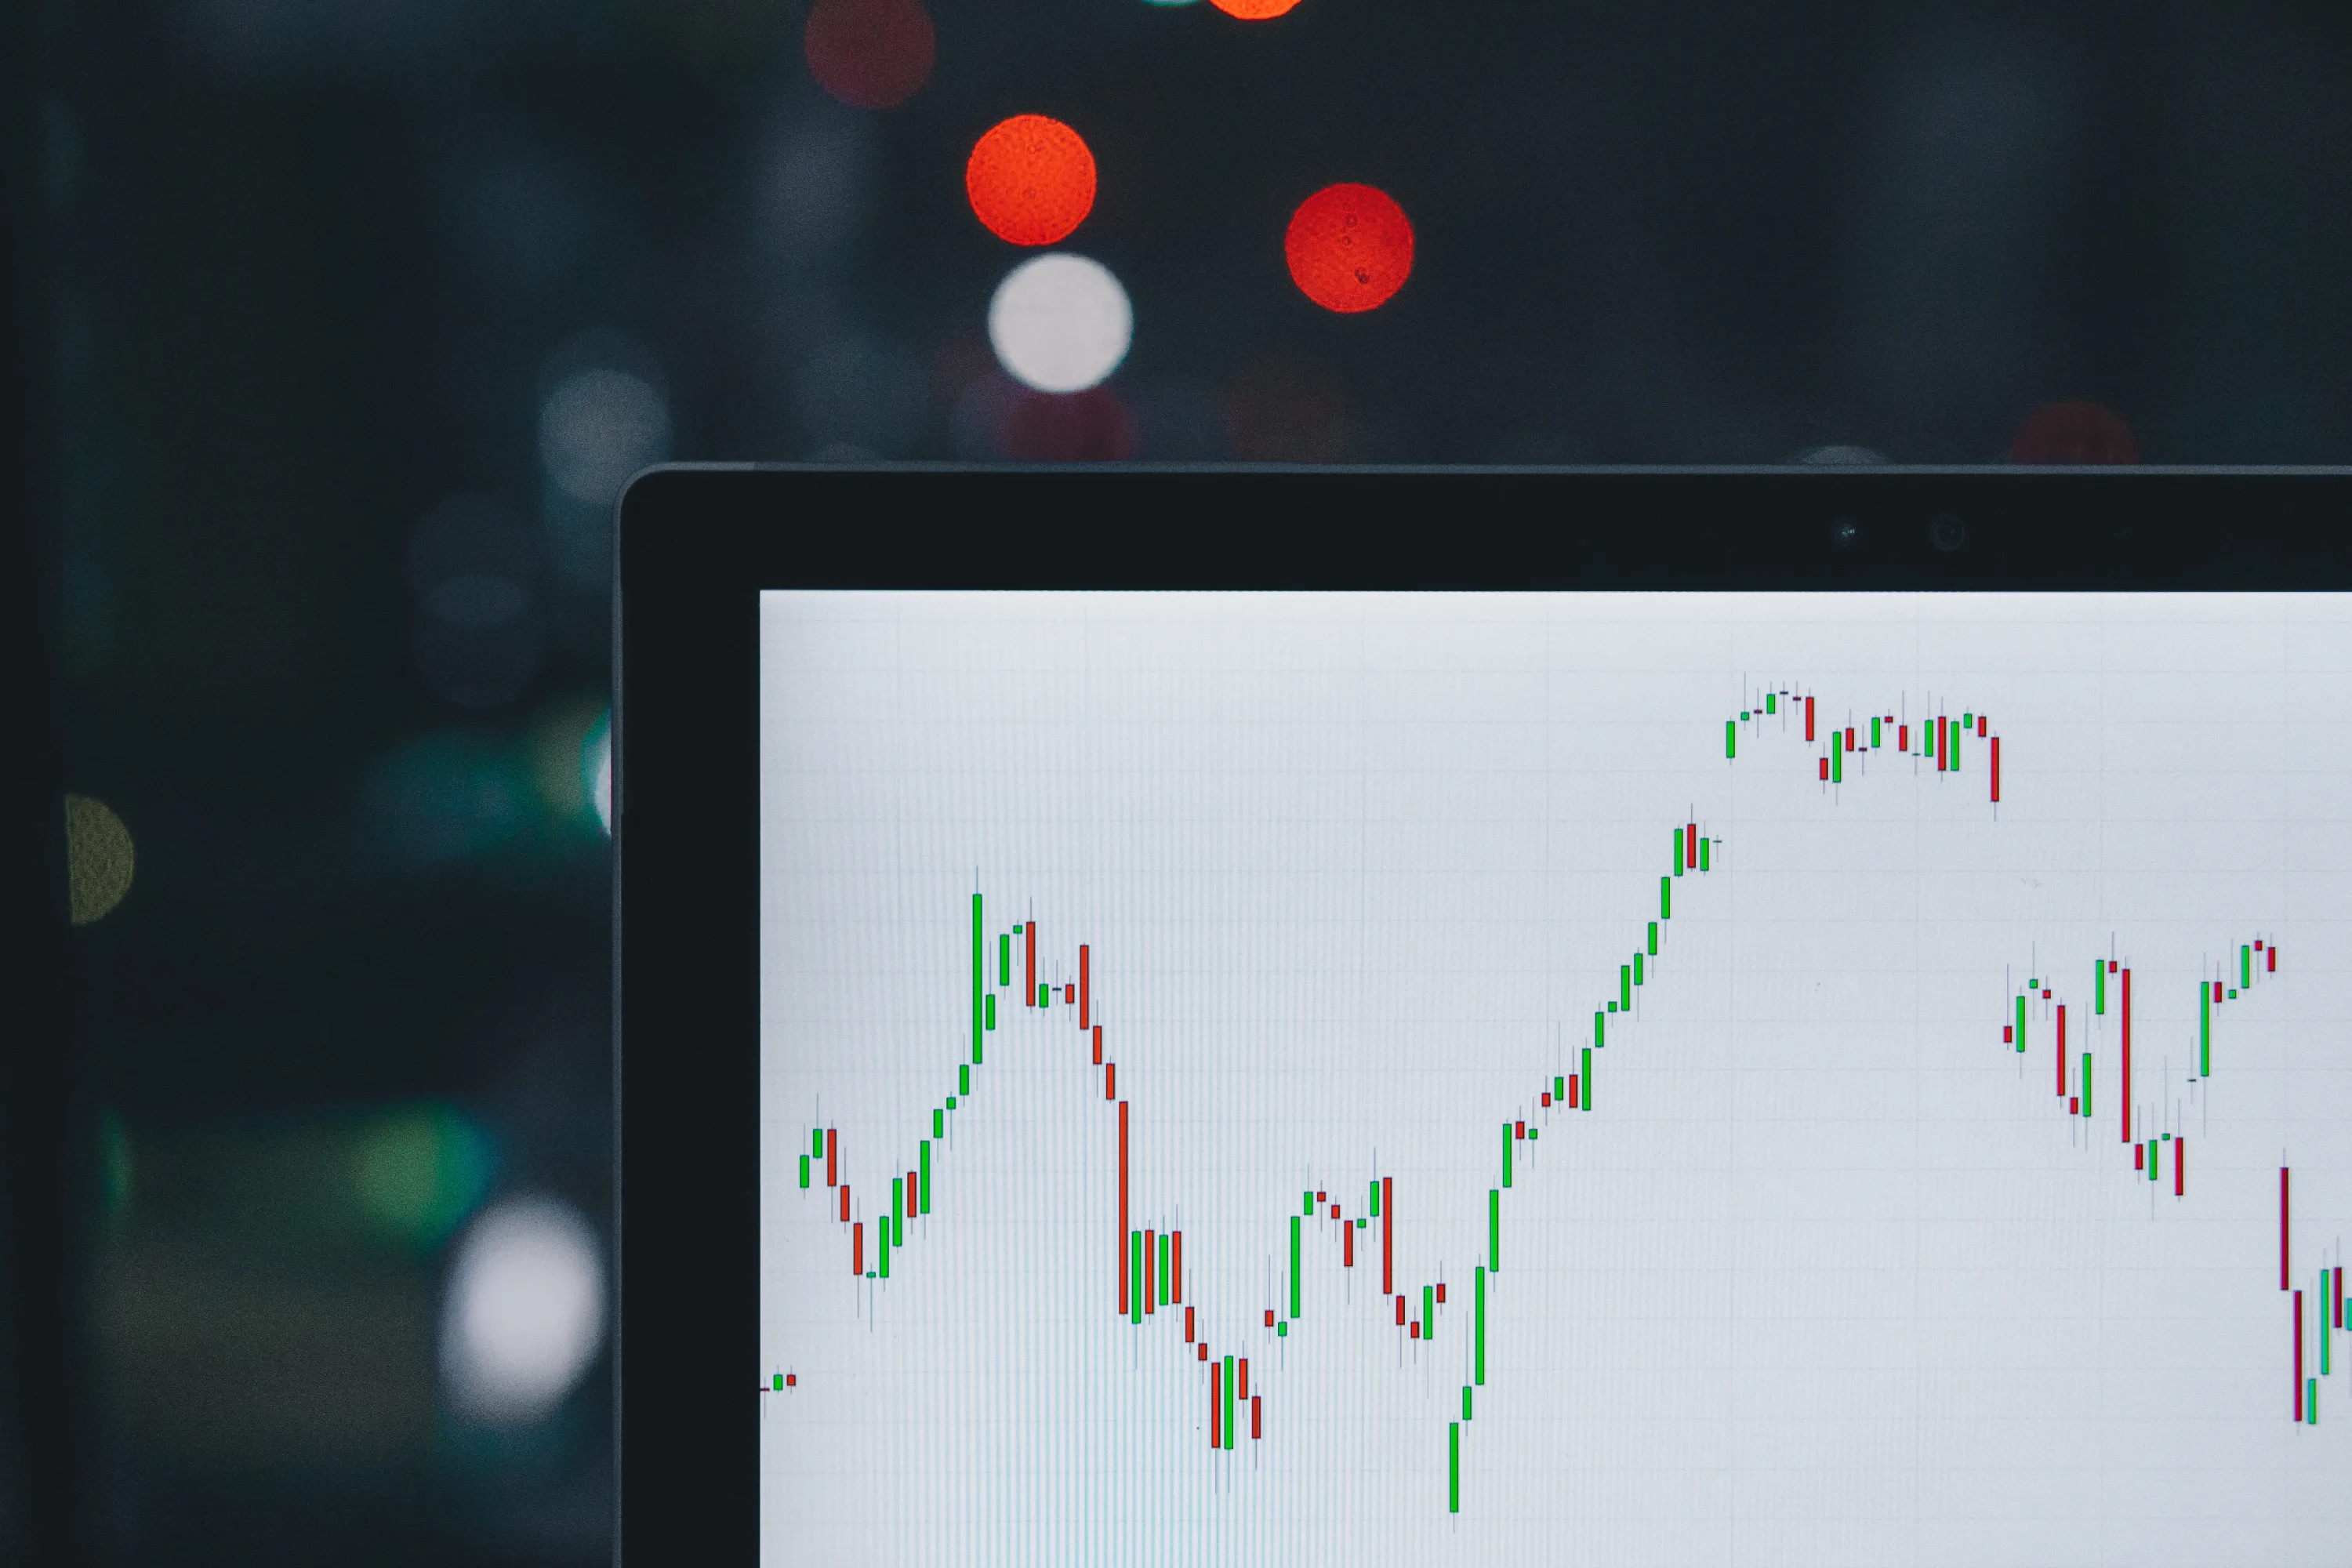
Candlestick charts are widely used because they provide a clear picture of price action at a glance. A candlestick has three parts: the body, which represents the range between the opening and closing prices, and two wicks, or shadows, which indicate the high and low prices for the period. A green or white candlestick signifies that the closing price was higher than the opening price, indicating upward momentum, while a red or black candlestick shows that the closing price was lower, indicating downward momentum.
Utilising Chart Patterns
Chart patterns can signify potential market movements. Some of the common patterns include:
- Head and Shoulders: Indicates a reversal in the current trend.
- Triangles: Can be ascending, descending, or symmetrical, and often signify a breakout.
- Double Tops and Bottoms: Signal that the market is about to turn in the opposite direction.
Indicators and Tools
In addition to chart patterns, various indicators can aid in reading binary options charts:
- Moving Averages: A tool that smoothes out price data to form a single flowing line, which can indicate the direction of the trend. Learn more with Moving Averages.
- Bollinger Bands: Comprise three lines where the middle line is the moving average, and the outer lines are standard deviations away. See Bollinger Bands for further details.
- MACD (Moving Average Convergence Divergence): Helps traders understand whether bullish or bearish movement is strengthening. The Macd indicator can provide insight into this.
- Fibonacci Retracement: A tool for identifying potential reversal levels, Fibonacci Retracement details can be crucial.
- ADX (Average Directional Index): Measures the strength of a trend and can be read about in more depth with Adx Indicator.
Strategies
Traders employ various strategies in conjunction with reading charts to maximise their chances of a successful trade:
- Price Action: Relies on the interpretation of the bare charts without the use of additional indicators. Detailed insights can be found at Price Action.
- Martingale Strategy: Involves doubling up on investments after losses, a strategy further explained under Martingale Strategy.
Platforms for Trading
Several platforms facilitate binary options trading, each with unique tools and advantages:
- Binary.Com
- Binarycent
- Binomo
- Empire option
- Expertoption
- Finmax
- Highlow
- Iq Option
- Marketsworld
- Metatrader 4
- Nadex
Educational Resources
For those looking to deepen their knowledge, educational resources are abundant:
- Books: Many books are available that delve into binary options trading strategies and chart analysis.
- Online Courses: Platforms like Binary Options Education offer courses on binary options trading.
- Seminars and Webinars: Often hosted by trading platforms or financial experts.
- Trading Communities: Joining forums or groups like Binary Options UK can provide support and insight.
Regulations in the UK
It’s essential to be aware of the regulatory environment in the UK. The Financial Conduct Authority (FCA) is the regulatory body overseeing binary options trading, and traders should always use an FCA-regulated broker to ensure they are protected by UK laws.
Remember, trading binary options is risky, and it’s vital to only invest money that you can afford to lose. Comprehensive education and practice through demo accounts can significantly improve a trader’s skill in interpreting binary options charts and potentially lead to more successful trades.
Strategies for binary options trading should be approached with meticulous care, especially within the UK where the market environment is regulated by the Financial Conduct Authority (FCA). Traders in the UK looking to engage in binary options can adopt a variety of strategies to enhance their probability of successful trades.
One foundational strategy is the use of technical indicators which can provide a structured approach to trading. The Cci Indicator, which stands for Commodity Channel Index, is a versatile tool that binary options traders can use to identify cyclical trends. Similarly, the Chaikin Money Flow Indicator can be instrumental in gauging the buying and selling pressure for a given asset.
The Commodity Channel Index offers insights into market trends and is particularly useful in identifying new trends or warning of extreme conditions. Traders might also benefit from the Demarker Indicator, which aims to identify overbought and oversold conditions.
Channels are another set of tools that traders can use, with the Donchian Channel Indicator being one such method that plots the highest high and lowest low over a set period of time. Meanwhile, the Hull Moving Average provides a faster and more responsive version of the traditional moving average, which could be more suitable for short-term trading.
For those looking at a more comprehensive technical analysis, the Ichimoku Kinko Hyo Indicator, or Ichimoku cloud, offers a multitude of information on support/resistance, momentum, and trend direction. The Keltner Channel Indicator is another channel-based indicator that shows the range of price movement relative to a central line.
Market forces can also be understood through indicators such as the Mfi Indicator (Money Flow Index) which is used to identify overbought or oversold conditions by analysing price and volume. The Obv Indicator (On-Balance Volume) is another volume-based indicator that combines volume and price to show how much volume is flowing into or out of a stock.
For momentum trading, the Rsi Indicator (Relative Strength Index) and the Rvi Indicator (Relative Vigor Index) can be crucial for identifying the speed and change of price movements. Similarly, the Sar Indicator (Stop and Reverse) can help in determining the end of a trend.
The Stochastic Indicator is a momentum indicator comparing a particular closing price of a security to a range of its prices over a certain period of time, which is crucial for identifying potential reversal points. The Trix Indicator looks at the rate of change of a triple-smoothed exponential moving average, helping to filter out insignificant price movements.
Volume plays a significant role in confirming trends, and the Volume Indicator can be an essential aspect of confirming breakouts and trends. Additionally, the Williams R Indicator is a momentum indicator that measures overbought and oversold levels.
Pattern recognition is also fundamental, and the Zig Zag Indicator helps traders recognize trends by eliminating market noise. Beyond technical analysis, understanding the Market Sentiment can also provide an edge, as it reflects the overall attitude of investors toward a particular security.
Lastly, risk management cannot be overlooked. It is vital to set proper trade sizes and limit orders to manage potential losses. Traders should also be aware of the legal and tax obligations in the UK regarding binary options trading.
It is important to note that binary options trading carries a high level of risk and can result in the loss of all your funds. Binary options may not be legal in your jurisdiction. It’s your responsibility to check your local regulations before trading online. Always ensure that your broker is regulated by the FCA or another reputable regulatory body. Remember to practice your strategies on a demo account before implementing them on a live account.