
Candlestick charts, with their unique visual appeal and ability to provide in-depth market analysis, are quickly becoming the go-to choice for binary options traders. But what exactly are these charts? How can one read a binary options candle? What patterns should you look out for in order to maximize your profits? If you’re looking for answers to these questions – and more – then this is the article for you. Get ready as we explore the world of candlestick charts in binary options trading!
What Are Candlestick Charts?
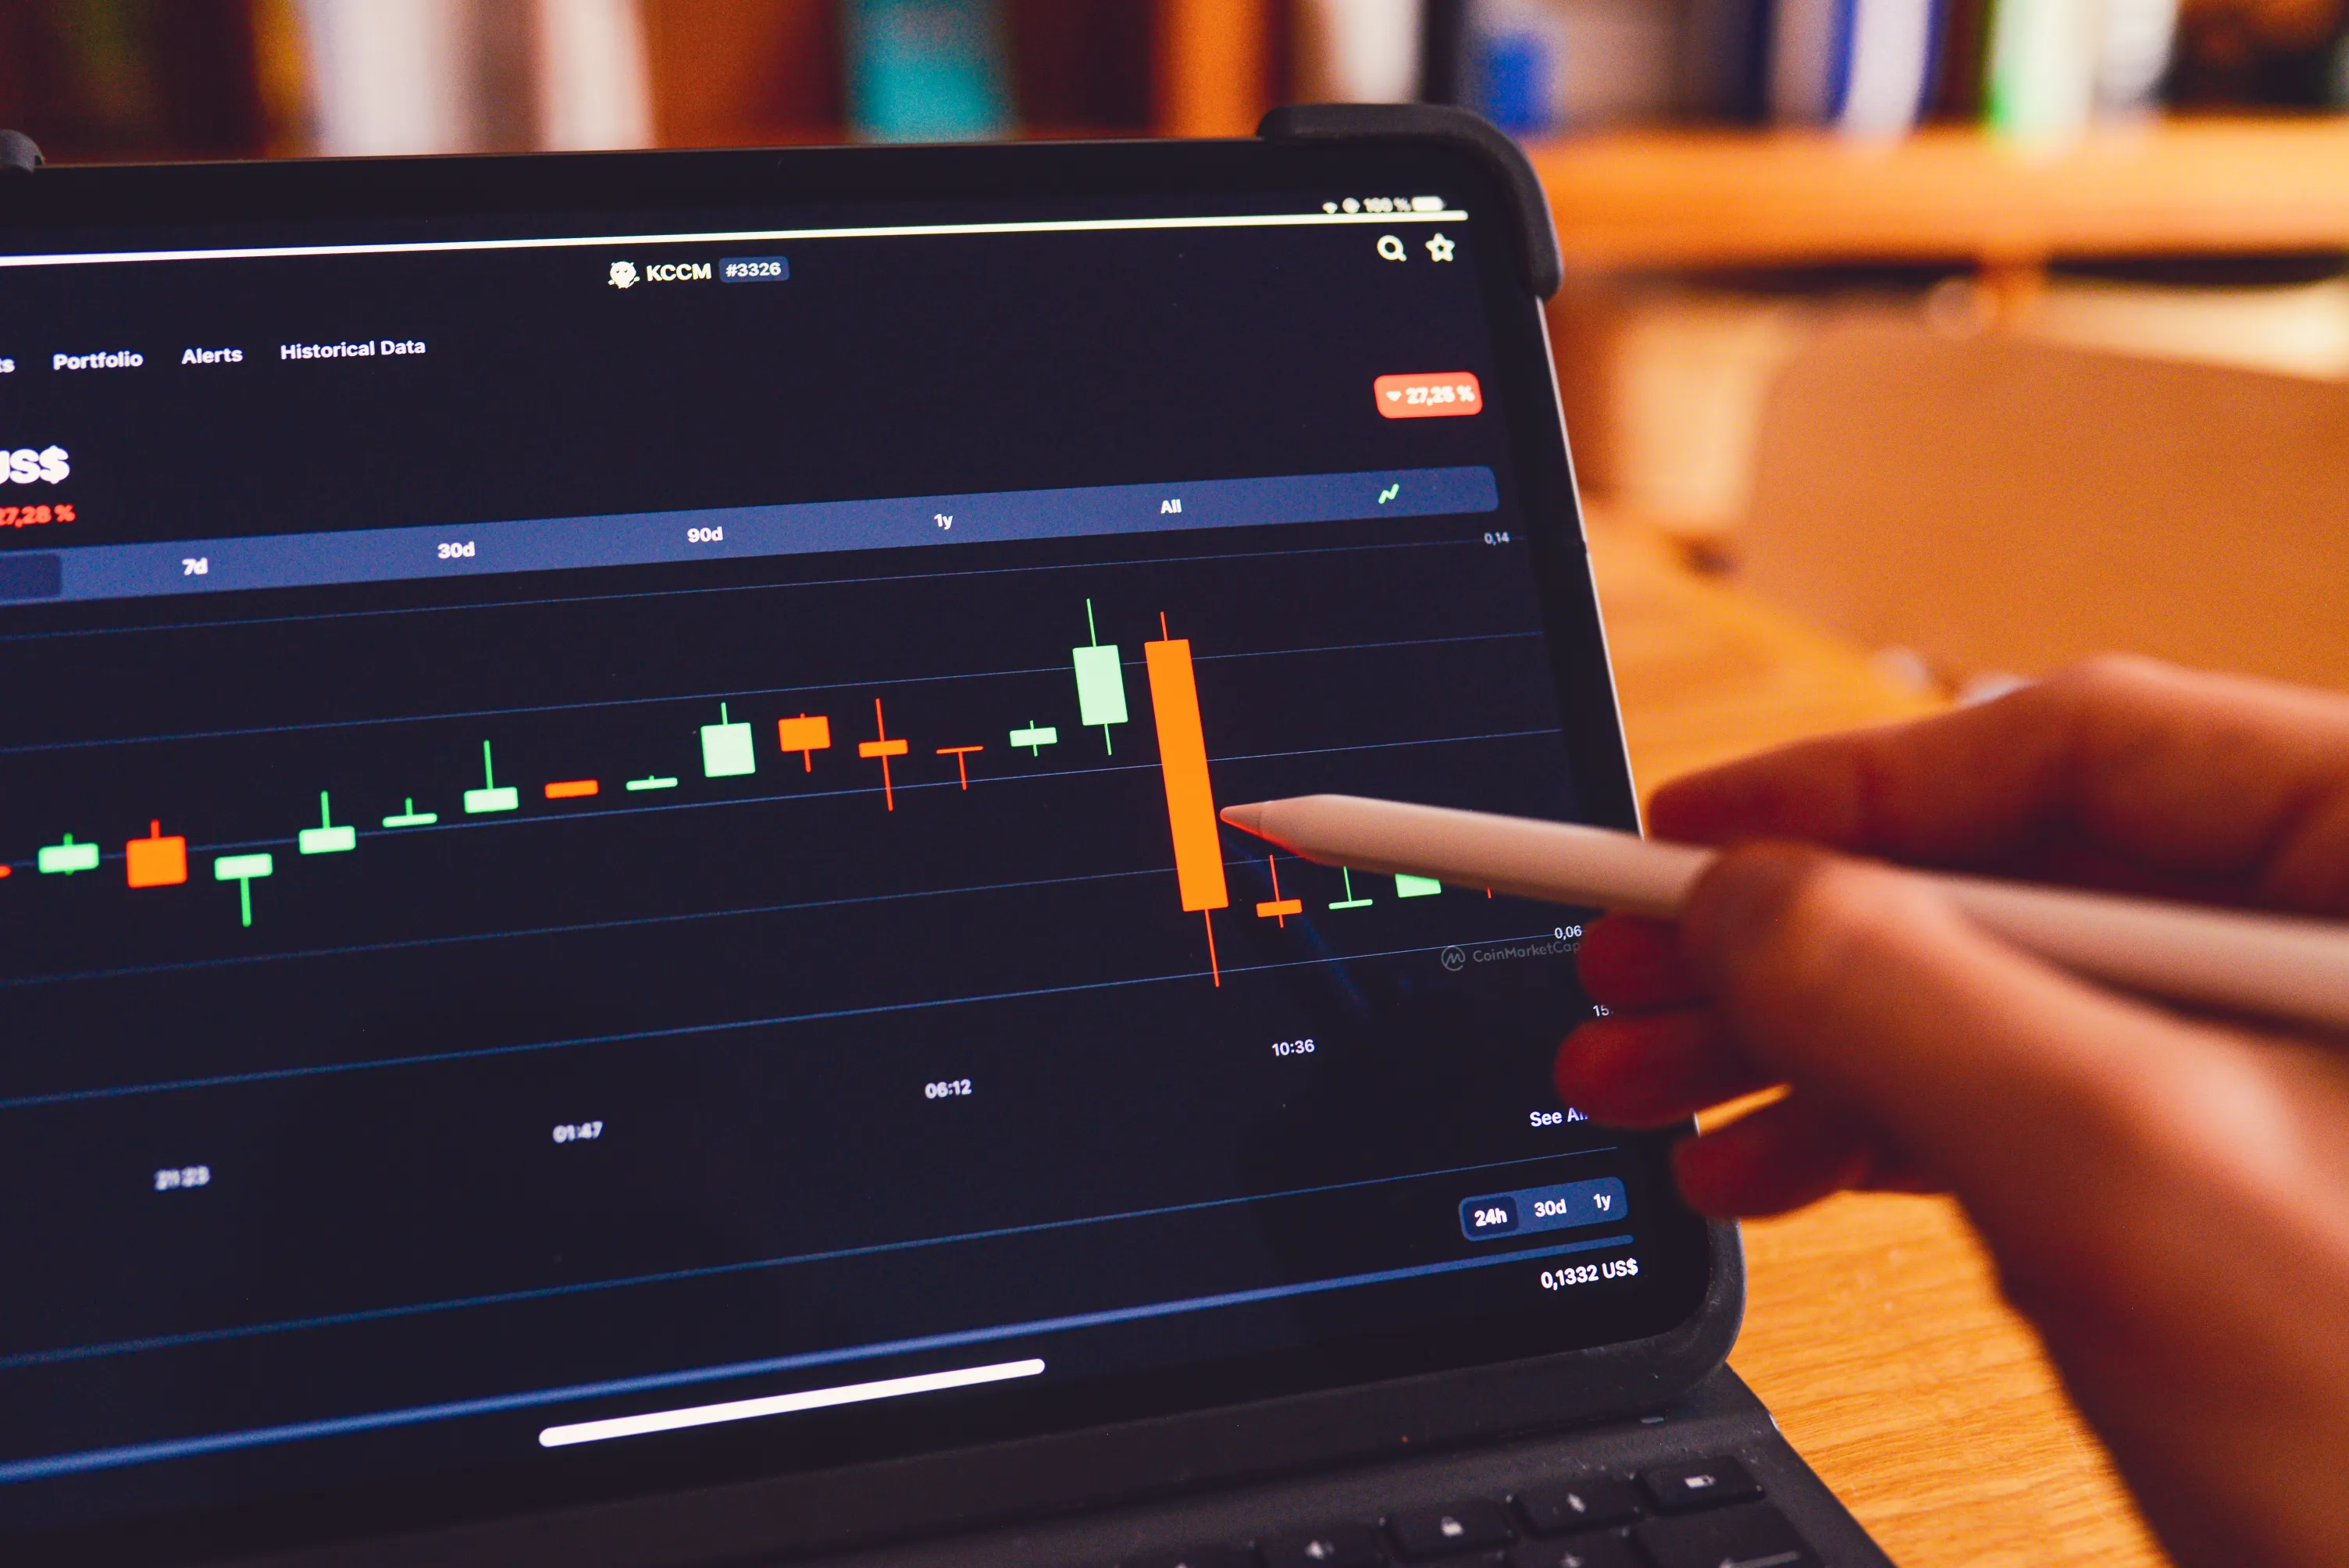
Candlestick charts, otherwise known as Japanese candlesticks, are one of the most popular charting methods used by traders to analyze financial markets. These charts allow traders to gain insight into price movements and trends over a certain period of time, such as minutes, hours, days or weeks. The candlestick chart contains a rectangular body that displays the opening and closing prices for a particular asset during a given time period. The body is accompanied by two thin lines, which represent the highest and lowest prices during the same time period.
Also read: How to Manage Risk in Binary Options Trading
Depending on if the close price is higher than the open price, there will either be a green (bullish) or red (bearish) candle. By analyzing these patterns and other technical indicators such as Bollinger Bands or moving averages, traders can identify potential trading opportunities and make informed decisions about when to enter or exit positions in order to maximize their profits.
How To Read A Binary Option Candle?
Reading a binary options candle is a simple process that can help traders identify potential trading opportunities. Binary options candles are typically composed of the same components as traditional candlestick charts – an open, close, high, and low price. The main difference between the two is that binary options candles may also contain additional information such as expiration dates or strike prices.
For example, if the body of a candle is green (bullish) and has a long upper wick compared to its lower wick (known as a ‘Bullish Engulfing Pattern’), it signals that buyers are outpacing sellers and prices may soon increase. Conversely, if there is a red (bearish) candle with a long lower wick compared to its upper wick (known as a ‘Bearish Engulfing Pattern’), it suggests that sellers are outnumbering buyers and prices may decrease going forward.
You may like: How to Trade Binary Options on Optionfield
Candlestick Components
Each candle on the chart patterns consists of a body and two wicks that detail open, closed, high and low prices over a single period of time. The body itself is either coloured green or red to indicate bullish or bearish market sentiment respectively. The wicks provide further information about price movements during the period in question.
How To Predict And Calculate The Next Candlestick?
When predicting and calculating the next candlestick, it’s important to use historical data and technical analysis. By studying the past trends of a particular asset, you can gain insight into its likely future movements.
Additionally, looking at indicators such as moving averages or Bollinger Bands can help you determine when the market is overbought or oversold and when there may be potential for a reversal. When interpreting candlesticks, it’s important to consider their real body – the part between the opening and closing prices – rather than just the wicks. The colour of the body will indicate whether it’s bullish or bearish. Finally, by recognizing patterns such as a bullish engulfing pattern or a bearish pattern, binary options traders can gain an edge in predicting future price action.
Relevant: How to Use the Keltner Channel Indicator in Binary Options Trading
The Top 3 Candlestick Patterns For Binary Options Trading
The candlestick chart is one of the most important tools for binary options traders. Candlesticks are used to analyse price movements, identify trends and predict future price action. There are many different types of candlestick patterns that can be used to help traders make more informed decisions when trading binary options. The three most common patterns are the Doji, the Bullish Engulfing Pattern and the Bearish Engulfing Pattern.
The Doji pattern indicates indecision in the markets and can indicate potential reversals. The Bullish Engulfing Pattern is a bullish reversal pattern that means buyers are in control and could signal an upward trend. Finally, the Bearish Engulfing Pattern is a bearish reversal pattern that signals sellers are in control and could indicate a downward trend.
How Effective Are Candlestick Charts?
While there is no guarantee that any given analysis will be correct, these patterns offer valuable insights into market sentiment and potential price movements. Candlestick charts have been used by traders for centuries, originally developed by Japanese rice traders in the 1700s.
Since then they have become a staple of technical analysis and are widely used today in binary options trading platforms. Candlesticks can not only help you identify potential trading opportunities but can also be used to formulate different trading strategies.
Similar: How to Use the Chaikin Money Flow Indicator in Binary Options Trading
Situations Where Candlestick Charts Work Best
Candlestick charts are ideal for short-term trading. Their ability to quickly represent the price action in a single time period allows traders to identify potential entry and exit points more accurately than with other chart types.
Candlesticks also work well in trending markets, as they can easily show whether buyers or sellers are in control of the market at any given moment. Finally, they are also useful for identifying potential support and resistance levels.
Related: How to Trade Binary Options on HighLow
Candlestick charts are an invaluable tool for binary options traders, giving them the ability to analyse price movements and identify trends with Doji, Bullish Engulfing Pattern and Bearish Engulfing Pattern, being the three most common candlestick patterns used in binary options trading. By understanding how to recognise these patterns, traders can get a better insight into potential changes in market direction, enabling them to make more informed decisions when trading binary options.
It is important to remember that while candlestick patterns provide helpful information, they should never be relied upon exclusively when making trading decisions; they should be combined with other technical indicators and analysis tools such as Bollinger bands and support/resistance lines.
Candlestick Charts in Binary Options Trading: A Comprehensive Guide for UK Traders
Candlestick charts are one of the most widely used and essential tools for traders in various financial markets, including binary options trading. These charts provide valuable insights into price movements, helping traders make informed decisions. In this comprehensive guide, tailored for UK readers, we will delve deep into the world of candlestick charts, exploring their history, construction, patterns, and how to effectively use them in binary options trading.
Chapter 1: Understanding Candlestick Charts
1.1 History of Candlestick Charts
Candlestick charts have a rich history dating back to 18th century Japan. They were originally developed by rice traders to analyze and predict rice prices. These charts were introduced to the Western world in the late 20th century and have since become a staple in technical analysis.
1.2 Anatomy of a Candlestick
A candlestick consists of three main parts:
- Body: The rectangular area between the open and closed prices. A filled (red or black) body indicates a bearish (downward) movement, while a hollow (white or green) body signifies a bullish (upward) movement.
- Wick (or Shadow): The thin lines extending above and below the body, representing the high and low prices during the trading period.
1.3 Types of Candlesticks
There are several types of candlesticks, each conveying different information:
- Bullish Candlestick: The close price is higher than the open price, indicating buying pressure and optimism among traders.
- Bearish Candlestick: The close price is lower than the open price, suggesting selling pressure and pessimism.
- Doji Candlestick: The open and close prices are almost identical, signifying indecision and potential trend reversal.
- Spinning Top Candlestick: The body is small, indicating uncertainty and a possible change in market sentiment.
Chapter 2: Candlestick Patterns
Candlestick patterns are combinations of one or more candlesticks that traders use to predict future price movements. Here are some essential candlestick patterns to be aware of:
2.1 Bullish Reversal Patterns
- Hammer: A single candlestick with a small body and a long lower wick. It suggests a potential bullish reversal after a downtrend.
- Bullish Engulfing: A two-candle pattern where the second candle completely engulfs the first. It signifies a shift from bearish to bullish sentiment.
- Morning Star: A three-candle pattern consisting of a large bearish candle, a small doji or spinning top, and a large bullish candle. It indicates a potential reversal from a downtrend to an uptrend.
2.2 Bearish Reversal Patterns
- Shooting Star: A single candlestick with a small body and a long upper wick. It suggests a potential bearish reversal after an uptrend.
- Bearish Engulfing: Similar to the bullish engulfing pattern, but in the opposite direction. The second candle completely engulfs the first, signalling a shift from bullish to bearish sentiment.
- Evening Star: A three-candle pattern comprising a large bullish candle, a small doji or spinning top, and a large bearish candle. It indicates a potential reversal from an uptrend to a downtrend.
2.3 Continuation Patterns
- Bullish Flag: A bullish continuation pattern characterized by a rectangular-shaped consolidation after a strong upward price movement.
- Bearish Flag: A bearish continuation pattern with a rectangular consolidation following a significant downward price movement.
- Symmetrical Triangle: A neutral continuation pattern where the price forms a triangle, indicating indecision before a potential breakout.
Chapter 3: Using Candlestick Charts in Binary Options Trading
Now that you have a solid understanding of candlestick charts and patterns, let’s explore how to use them effectively in binary options trading in the UK:
3.1 Entry and Exit Points
Candlestick patterns can help you identify potential entry and exit points for binary options trades. For example, if you spot a bullish engulfing pattern after a downtrend, it may be a signal to enter a “Call” option trade, expecting the price to rise.
3.2 Confirmation
Candlestick patterns are most effective when used in conjunction with other technical indicators and analysis methods. Confirm signals from candlestick patterns with tools like moving averages, RSI, or MACD for added confidence in your trades.
3.3 Time Frames
Choose the appropriate time frame for your binary options trading strategy. Shorter time frames, such as 1-minute or 5-minute charts, are suitable for high-frequency trading, while longer time frames, like 1-hour or daily charts, are better for swing trading and long-term predictions.
3.4 Risk Management
Implement proper risk management techniques, such as setting stop-loss orders and limiting the amount you invest in each trade. Never risk more than you can afford to lose.
3.5 Practice on a Demo Account
Before risking real capital, practice your trading strategies using a demo account. Most binary options brokers offer this feature, allowing you to refine your skills without financial risk.
3.6 Stay Informed
Stay updated on market news and economic events that could impact your chosen asset. Candlestick patterns are more reliable when backed by fundamental analysis.
Chapter 4: Common Mistakes to Avoid
While candlestick charts can be powerful tools, traders often make common mistakes. Here are some pitfalls to avoid:
4.1 Overtrading
Trading too frequently or with excessive capital can lead to substantial losses. Stick to your trading plan and risk management strategy.
4.2 Ignoring Confirmation
Don’t rely solely on candlestick patterns. Always use other technical indicators and analysis methods to confirm your signals.
4.3 Lack of Patience
Impatience can lead to entering trades prematurely. Wait for a strong signal and avoid chasing the market.
4.4 Emotional Trading
Emotions like fear and greed can cloud judgment. Stick to your strategy and don’t let emotions drive your trading decisions.
Chapter 5:
Candlestick charts are a valuable tool for binary options traders in the UK, providing insights into market sentiment and potential price movements. By understanding the various candlestick patterns and their implications, you can make more informed trading decisions.
However, it’s essential to remember that trading, including binary options, carries risks. There are no guarantees of profit, and losses are a part of the game. Always trade responsibly, manage your risk effectively, and consider your financial situation and risk tolerance.
For a step-by-step guide on how to trade binary options on various platforms, such as Binary.Com, Binarycent, Binomo, and others, check out our detailed resources. Additionally, explore other trading strategies and technical indicators to enhance
your trading skills.
Remember, success in binary options trading requires continuous learning, discipline, and a commitment to improving your trading strategies. Happy trading!
[Disclaimer: Trading binary options involves a high level of risk and may not be suitable for all investors. The information provided in this guide is for educational purposes and should not be considered financial advice. Always consult with a qualified financial advisor before making trading decisions.]